ONS data has revealed that total deaths in England and Wales in week 14 this year (week ending 3rd April) were 16,387, an increase of 6,082 on the 5 year average of 10,305. This was the first occasion that the average death toll in England and Wales has exceeded the 5 year average since mid-January. The ONS reports that these are heavily concentrates in London, with hotspots in the North-West and West Midlands too.
Nationally, the number of deaths attributed to Covid-19 in the week ending 3rd April was 3,475. This raises a serious concern about the causes of the additional 2,607 deaths.
A total of 2,367 deaths during the reporting week were attributed to influenza and pneumonia which could be undiagnosed Covid-19 but this figure is only 303 higher that the equivalent 5-year average for similarly deaths (2,064) so this is not the answer. How do we explain the 2,000+ additional deaths?
Breaking this down to the regional scale, using my own calculations of average weekly death rates from the past 5 years of data provided by ONS gives the following comparable death rates for the week 14, which was the first full week of lockdown in the UK, ending on 3rd April 2020:
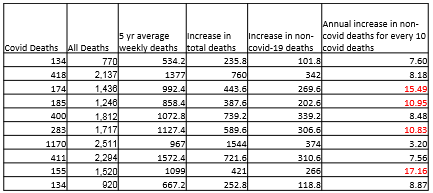
The right hand column compared the increase in non-Covid-19 deaths with the increase in Covid-19 deaths. Where it is coloured red, this indicates that a greater increase in deaths resulting from FACTORS OTHER THAN COVID-19 than from Covid-19 itself. In two regions, for every 10 deaths resulting from Covid-19, we are seeing more than 15 additional lives lost which would not be lost in a normal year.
At this stage, the assumption is that people who did not die of Covid-19 are in the “Non-Covid” category. This is where we need to introduce Government Statistics of people dying who tested positive with the virus but for whom it was not their registered cause of death.
In the same week, government data for deaths associated with Covid-19, a broader measure, returned higher toll by a total of 470 losses of life. If we reduce the non-Covid death rate in line with this so as not to mis-attribute these case, an adjusted set of figures is shown below.
|
Region |
Covid Deaths |
Increase in non-covid19 deaths compared to 5yr averages (adjusted) |
Increase in non-covid deaths for every 10 covid deaths |
|
North East |
134 |
83.62 |
6.24 |
|
North West |
418 |
280.91 |
6.72 |
|
Yorkshire & Humber |
174 |
221.44 |
12.73 |
|
East Midlands |
185 |
166.41 |
9.00 |
|
West Midlands |
400 |
278.61 |
6.97 |
|
East |
283 |
251.83 |
8.90 |
|
London |
1170 |
307.19 |
2.63 |
|
South East |
411 |
255.12 |
6.21 |
|
South West |
155 |
218.49 |
14.10 |
|
Wales |
134 |
97.58 |
7.28 |
We have to recognise that the government dataset has faced additional criticism for missing deaths at home and in care homes so this too is expected to overstate the proportion of non-Covid deaths. Nevertheless the important point that there are strong regional variations, which we would expect to be greater at more localised scales, adding weight to calls for a regional relaxation of lockdown to save lives. As more detailed information is provided from ONS, we urgently need to identify whether the additional deaths are unreported Covid-19 consequences or other consequences of the state imposed lockdown.
Data from week 17 (w/e 24th April) now analysed. The high increases in non-covid deaths did not hold up as Covid started claiming more deaths. However, as lock-down has persisted, the number has been creeping up once more.
Taking the average rates across all regions, we saw 9.83 additional deaths in week 14 for every 10 covid deaths. This fell to 2.78 additional deaths in week 15 but then began to increase again. The data shows that 3.65 additional deaths (that’s compared to a 5 year average and excluding covid deaths) in week 16. This rose again to 3.98 additional deaths per 10 covid deaths in week 17. Hopefully this is part of the rationale for easing lockdown.